While purchasing frenzy lessened in 2022, outlook remains positive.
By Anthony Kioussis
Aviation Polls Cofounder
There were approximately 10% fewer turbine-powered aircraft transactions in 2022 compared to the previous year’s record-setting figure, but, from an industry health perspective, last year ended by posting very positive year-over-year statistics.
Analysis of 134 models revealed that, compared to December 2021, turbine aircraft demand was slightly higher, aircraft availability increased by more than 20%, new production orders continued to expand the OEMs’ backlogs, average used aircraft Ask Price was up nearly 80% from last December’s record-low figure, and the aircraft marketability figure (ETP Ratio) posted a improvement.
What should we expect during 2023? Q1 sales figures revealed a slower start to the year, but with the purchasing frenzy ending, steady business volume is a welcomed
environment.
Availability
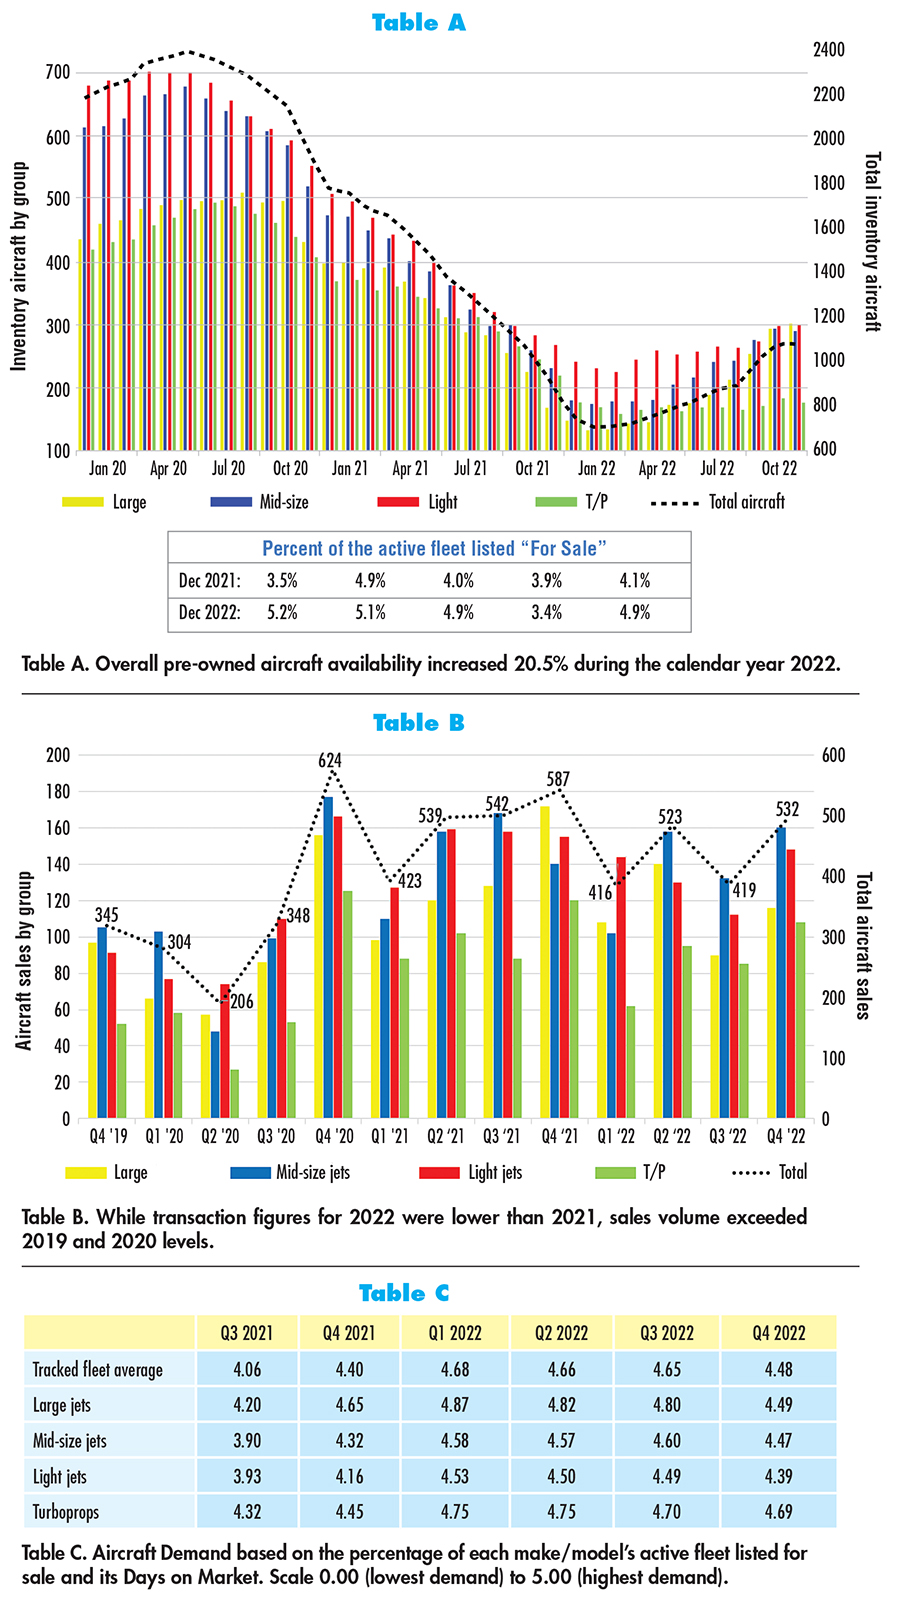
Following a June 2020 peak, turbine aircraft availability declined steadily, with inventory dropping nearly 54% during 2021 and nearly 63% since the peak figure. (See Table A). However, all 3 jet groups posted an availability increase during 2022.
Large jets led the way, increasing by 79.2%, midsize jet inventory was up 25.1%, and light jet availability rose 12%. Turboprops did not fare as well, with inventory dropping 19.3%, but one should keep in mind the continued strong demand, which hit record levels during the past calendar year.
Activity from traditional corporate operators increased during the year, due in large part to new production aircraft deliveries. The need for these operators to sell their existing aircraft helped improve availability somewhat, addressing the used aircraft void created by first-time buyers.
Approximately 4.9% of our tracked active fleet was listed for sale at the end of 2022, compared to 4.1% at the end of 2021. While selection among younger, lower-time models is far from optimum, some improvement was noticeable.
Transactions
With frenzied buying abatting, transactions were down 9.6% in 2022, with all 4 groups posting lower sales volume. Table B details the total quarterly sales figures (commencing in December 2019) for our 134 tracked models.
As in past years, the number of transactions followed the traditional decrease between Q4 and Q1 last year. What was historically unusual was the drop in sales transactions between Q2 and Q3. The negligible inventory increase posted by light jets and turboprops during Q3 last year (read limited selection for buyers) may have led to the transaction volume decrease.
Finally, while Q4 reflected the lowest quarterly sales figure for the past 3 years, transactions increased more than 54% compared to Q4 2019.
Demand
As Table C shows, based on the percentage of each make/model’s active fleet listed for sale and its Days on Market, aircraft demand peaked during Q1 for all but the midsize jet group. Demand receded for the remainder of the year, but the Q4 figure was still higher year-over-year – except for large jets.
As some of you might recall, demand skyrocketed during the second half of 2021, ending the year with the highest recorded demand figures. Accordingly, although the “purchasing frenzy” period may have ended, demand continues to be very high.
Quality Rating & Maintenance Exposure
Quality Rating calculates the remaining useful life associated with each aircraft component and individual maintenance event, while also accounting for the cost to replace each part and/or complete each maintenance event, compared to the aircraft’s condition the day it came off the OEM’s production line.
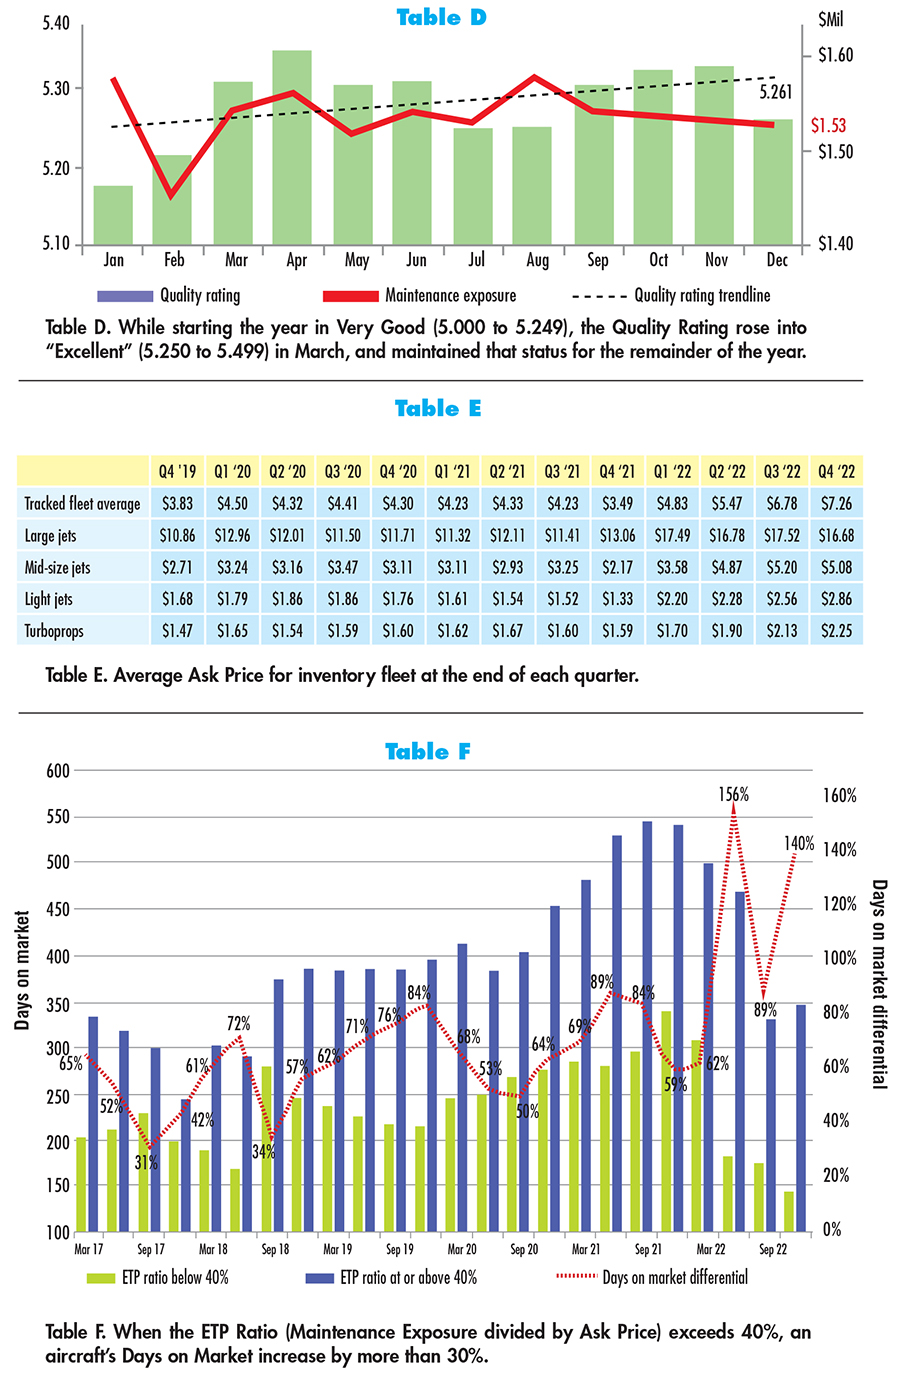
During 2021, our tracked inventory fleet’s Maintenance Rating started the year within the “Excellent” range (5.250 to 5.499), and then decreased into “Very Good” territory (5.000 to 5.249) at 5.146. However, the story was quite different during 2022. (See Table D). Starting the year within the “Very Good” range, at 5.177, the Quality Rating rose into “Excellent” territory in March, and maintained that status for the remainder of the year.
Maintenance Exposure measures an aircraft’s embedded/accrued maintenance, and takes into account the cost of each component and maintenance event completion cost. Therefore, if an aircraft is 75% toward an event, and the event averages $1000 to complete, the asset’s Maintenance Exposure for that specific event would be $750.
Maintenance Exposure peaked in January and ended the year slightly lower/better than the December 2021 Exposure level, signaling that upcoming maintenance events for the inventory fleet would be less expensive to complete.
Values
Statistically, average Ask Price rose nearly 80% during 2022. However, to understand aircraft “values” requires an explanation of the difference between Ask Prices and Transaction Values.
Average Ask Price (Table E) decreased nearly 19% during the calendar year 2021, ending at a record low figure. However, it is important to remember that aircraft inventory during this period consisted of a heavily picked-over fleet. Younger, lower-time aircraft moved quickly during 2021, often without a public listing (sometimes at a Transaction Value that exceeded the seller’s expectation), primarily due to buyer “purchasing frenzy.” Therefore, to assume that Transaction Values for desirable aircraft were low when we closed out 2021 would be incorrect.
While actual “listings” for desirable aircraft increased somewhat during 2022, the Ask Prices sought by many sellers of undesirable assets reflected a hope their aircraft might actually be worth more. Actual sales and Transaction Value history proved this theory to be incorrect, but the average Ask Price for listed assets did rise. In fact, as Table E indicates, figures for listed midsize and light jets were up 135% and 115%, respectively. However, very few aging assets actually attained anywhere near that level of value increase during the past year.
Marketability
We measure aircraft Marketability through the Maintenance Exposure to Ask Price Ratio, or ETP Ratio.
The ETP Ratio is calculated by dividing an aircraft’s Maintenance Exposure by its Ask Price. As the ETP Ratio decreases, the asset’s value increases in relation to the aircraft’s price. Days on Market analysis has shown that when the ETP Ratio is greater than 40%, a listed aircraft’s Days on the Market (DoM) increase – in many cases by more than 30%. (See Table F).
Our tracked inventory fleet’s ETP Ratio ended the year slightly higher/worse than the 12-month lowest/best figure it posted in November, but the figure also reflected a 40% year-over-year improvement. All 4 groups posted better/lower year-over-year figures, with midsize jets and light jets registering annual low/best figures to close out 2022.
During 2021, the listed fleet’s average DoM increased 6.9%, ending the year at 452, which remains the highest/worst figure to date. What a difference a year can make, as the average DoM decreased 53.3% to record an all-time low/best 211 to close out 2022. In addition, assets whose ETP Ratio was 40% or higher were listed for sale more than 140% longer (on average) than aircraft whose Ratio was below 40% (346 versus 144 DoM).
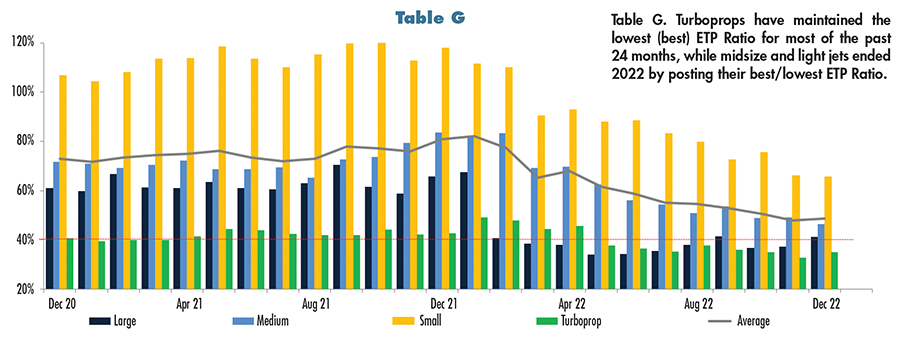
Turboprops maintained the lowest/best ETP Ratio for all but 5 of the past 24 months. (See Table G). Large jets ended the year at 41.3% – slightly worse than/above the 40% “excessive Exposure” demarcation point, while medium and light jets ended 2022 by posting their best/lowest ETP Ratios of 46.3% and 65.6%, respectively.
Market summary
Based on the high turbine aircraft demand figures, increasing pre-owned aircraft availability figures, ongoing increases to the OEMs’ backlog, strong listed asset Ask Prices, and solid aircraft marketability Ratios across the listed fleet, 2023 may not be another record-breaking sales year, but sales volume will probably be noteworthy.
Market sentiment regarding the near future appears to be generally positive, based on recent surveys conducted by Aviation Polls. (See www.avpolls.com).
When asked what they anticipated will happen to pre-owned turbine aircraft transaction prices during Q2 2023 compared to Q1 2023, 75% of all respondents felt that actual Transaction Prices will be somewhat lower. That would indicate a market moving toward equilibrium, which is always positive for buyers and sellers.
When asked what they anticipated will happen to pre-owned turbine aircraft inventory during Q2 2023 compared to Q1 2023, respondents were equally split, with half believing that overall inventory will increase, as well as for younger, lower-time aircraft, while the other half thought inventory will remain about the same, as well as for younger, lower-time aircraft. Our guess is that reality is likely to be somewhere in between.
Lastly, when asked what they anticipated will happen to pre-owned turbine aircraft transaction volume during Q2 2023 compared to Q1 2023, half of all respondents thought the number of transactions will remain about the same, while the remaining voters were equally split between transaction volume being somewhat higher and somewhat lower. Based on the way this question was posed, we believe all of the respondents might be able to claim their answer was correct. Stay tuned!
 Tony Kioussis is cofounder of Aviation Polls. His aviation career spans nearly 4 decades, and includes experience with Asset Insight, GE Capital’s Corporate Aircraft Finance Group, Jet Aviation, British Aerospace’s JSX Capital, The K Group, and JSSI.