Avoiding bumpy rides
Understanding turbulence can be key to a smooth flight.
By Karsten Shein
Comm-Inst. Climate Scientist
The pilots of the intercontinental business jet had just finished transmitting their position report from FL330 over the Philippine Sea when one noticed the contrails of a commercial jet approaching their position a few thousand feet above their altitude. As the commercial aircraft grew nearer, the pilots could see it was an Airbus A380 that would cross their path as it headed out over the North Pacific.
Immediately, the pilot monitoring told the passengers to buckle up as the pilot flying disengaged the autopilot and pushed the stick forward into a smooth but rapid descent. Both pilots had heard stories of smaller aircraft being upset by wake turbulence from the massive A380s.
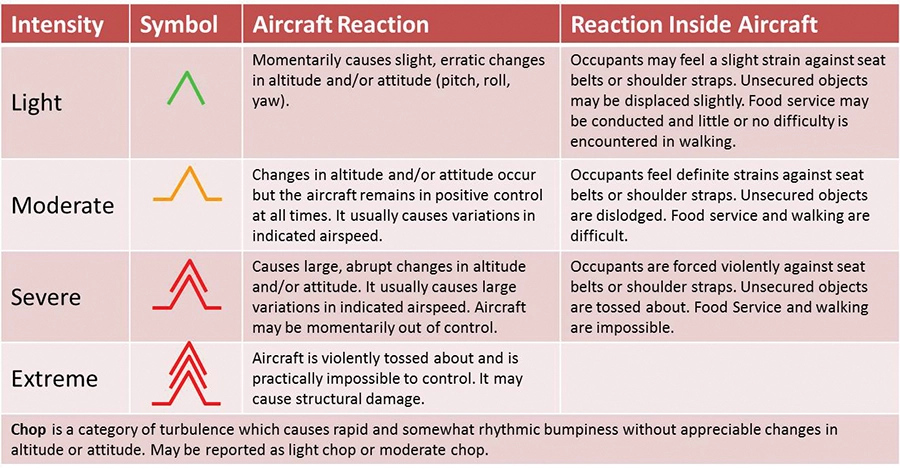
Turbulence intensity table. Intensity is somewhat subjective to the aircraft and pilot, but pilots are encouraged to report any turbulence they encounter.
The move gained them about 3000 ft of additional vertical separation as they passed beneath the spreading condensation trail from the heavier aircraft – but, more importantly, it got them safely under the descending wake vortices from the larger aircraft’s massive wings.
Wake turbulence is just one type of turbulence that pilots may encounter during their flights. Although it is most commonly experienced when departing or landing behind or on a parallel runway to a larger aircraft, it can also occur when flying behind and beneath the path of large jets at cruise altitude, because wake vortices tend to sink after production.
Unfortunately, as with most severe to extreme turbulence, such encounters can cause loss of control, damage to smaller aircraft, and injuries to passengers.
Avoiding encounters with turbulent air is not always possible. Dodging wake turbulence, for example, is a matter of maintaining situational awareness relative to other aircraft and not following too closely behind departing large jets or getting too close to hovering helos. But encounters can be reduced and managed by understanding the hows and whys behind turbulence.
Turbulence is a disturbance in airflow caused by a variety of factors, but all are the result of uneven solar heating of the Earth’s surface that creates vertical and horizontal air currents. We can further categorize turbulence into thermal and mechanical.
The former is attributed to convective vertical air movement, while the latter is created as air moving at a given velocity is disrupted by an obstacle or simply passing by air moving at a different velocity. In general, air that is moving at less than 20 kts is unlikely to produce more than light turbulence.
Turbulent eddies
Turbulence occurs as the air current shears off at its edges into eddies, which are waves or whorls of air that range from tiny (no more than the swirl of leaves on a sidewalk) to hundreds of meters or more, as occurs in clear air turbulence (CAT) around the jet stream. The faster the air moves, the stronger the turbulent eddies. Eddies can shear off in any direction, and, as they curl into the slower moving air around them, they produce what we know as gusts.
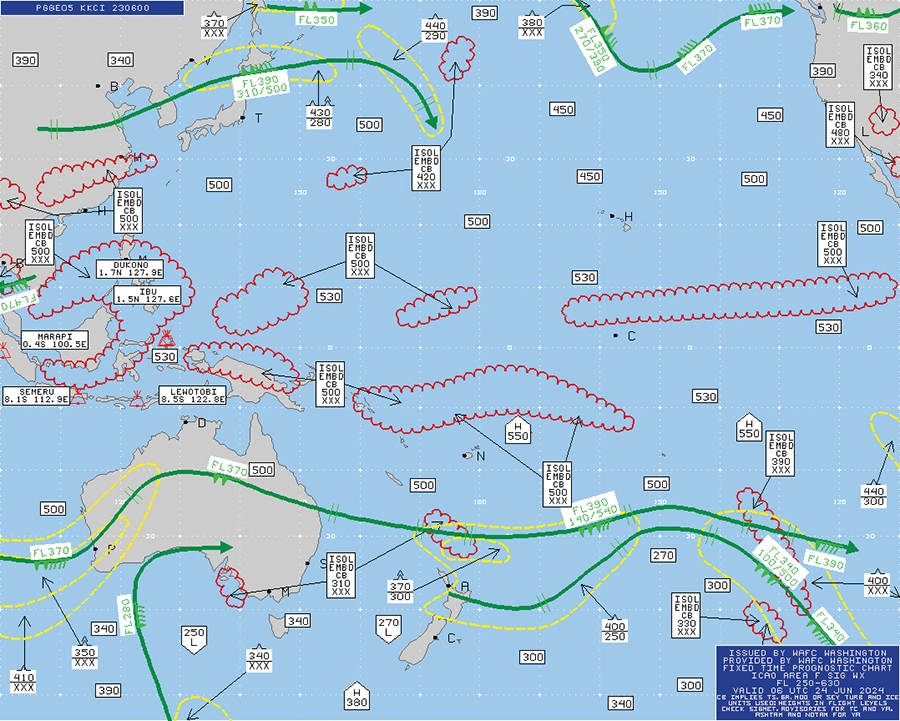
High-level significant weather prognostic chart over the Pacific Ocean. Areas of moderate or greater turbulence are indicated by yellow dashed lines and are normally found around the green jet stream lines and red scalloped areas of convection. The numbers correspond to the flight levels at which the turbulence is expected and the strength is symbolized.
Pilots arriving or departing airports on a hot summer afternoon will undoubtedly encounter thermal turbulence from rising surface air heated by the unrelenting sun. While it can be almost impossible to avoid this sort of turbulence, its normally little more than light chop limited to a few thousand feet above the field. Often, its vertical extent is marked by the base of scattered cumulus.
Usually, only when the atmosphere is more unstable – with afternoon thunderstorms kicking off around the airport – does this thermal turbulence become stronger. Pilots can avoid this thermal turbulence simply by planning arrivals and departures to avoid the hottest parts of the day. However, early morning departures may encounter a thin layer of chop as they pass through the nocturnal temperature inversion.
The strongest thermal turbulence is produced by the updrafts and downdrafts of storm cells. These currents can move at over 100 kts and create extreme turbulence that can rip aircraft apart. The best way to avoid this sort of turbulence is simply to steer clear of any known thunderstorm activity (or convective sigmet region), and particularly avoid any cumulonimbus by at least 1 nm per 1000 ft of tops. Downbursts and storm gust fronts also create severe turbulence and low-level windshear as they spread out along the ground.
Mechanical (shear) turbulence can form in the lee of any obstacle, from hangars and towers to massive mountain ranges. Turbulent eddies form as air moves around the obstacle and friction from the obstacle changes its speed and direction. With wake turbulence, it is the obstacle moving through the air, but the effect is the same – airflow over the wings is shed in continuous eddies (vortices). In general, and depending on the wind speed, mechanical turbulence can persist for a distance many times the height of the obstacle.
Because this turbulence is frequently encountered at takeoff or landing, it may be unavoidable. But pilots can look to the wind direction and speed relative to the runway, and the presence of nearby upwind obstacles. Unless your POH has other guidance, you may increase approach speed by half the difference between the sustained and gust speed.
You may also steepen your approach or climb out to spend as little time as possible in surface turbulence, and reduce flaps to reduce the chance of catching a gust. Of course, if the addition of gust speed will take you over your crosswind limits, you should consider diverting to a different runway or airport.
Windshear turbulence
Turbulence also occurs as the wind at one altitude moves faster than or in a different direction from the air adjacent to it. Friction at the flow boundary creates the shear eddies that shed into the slower air, or in both currents if only the directions are different.
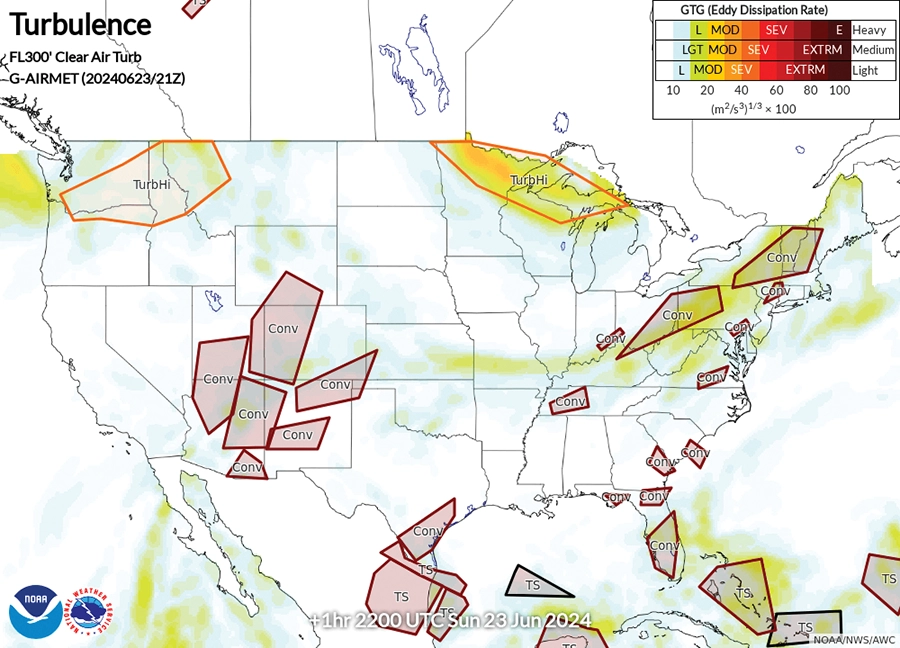
US National Weather Service turbulence forecast shows model estimated regions of CAT, mountain wave activity, and convection at user-selectable levels and lead times.
Shear is often encountered near the surface, because friction with the surface causes the surface air to slow rapidly relative to the air just above it. It is also present along frontal boundaries where the winds behind the front are moving in one direction and those ahead of the front are moving in another.
More frequently, it is present at a few spots aloft. Weak shear can occur where the light winds of the surface layer of the atmosphere meet the stronger winds of the free atmosphere. Low-level jet streams sometimes occur at this interface, which can increase the chance of turbulence.
The strongest shear turbulence is encountered much further aloft, near the jet streams that occur at the upper edge of the troposphere. These ribbons of air can reach speeds of 150 kts easily, and may twist and turn rapidly. The bases of deep jet stream troughs are frequently where severe to extreme CAT can be found. Fortunately, CAT aloft is usually confined to a narrow altitude block and doesn’t extend too far from the edge of the jet stream.
Turbulence forecasts, particularly forecasts of moderate or greater turbulence aloft, are delivered via Significant Weather prognostic charts. These charts are ideal for route planning to take advantage of favorable winds while avoiding areas of expected CAT.
Tools such as the NWS Aviation Weather Center’s turbulence forecast for the US let pilots see forecast areas of turbulence from CAT, mountain waves, and convection at many levels and out to 18 hours ahead of time. Even without forecast graphics, pilots can look at forecast winds and the position of fronts and convective sigmets to determine likely locations for encountering turbulence.
Lastly, pilots are encouraged to report turbulence they encounter. Intensity is divided into light, moderate, severe, and extreme. Intensities are displayed on maps as a caret or stacked carets corresponding to strength. Naturally, strength is largely subjective to the size of the aircraft and pilot experience. What may be severe turbulence in a light jet may be moderate at best in a larger aircraft. So, including aircraft type is critical when filing a pirep for turbulence.
 Karsten Shein is cofounder of 2DegreesC.org. He was director of the Midwestern Regional Climate Center at the University of Illinois, and a NOAA and NASA climatologist. Shein holds a comm-inst pilot license.